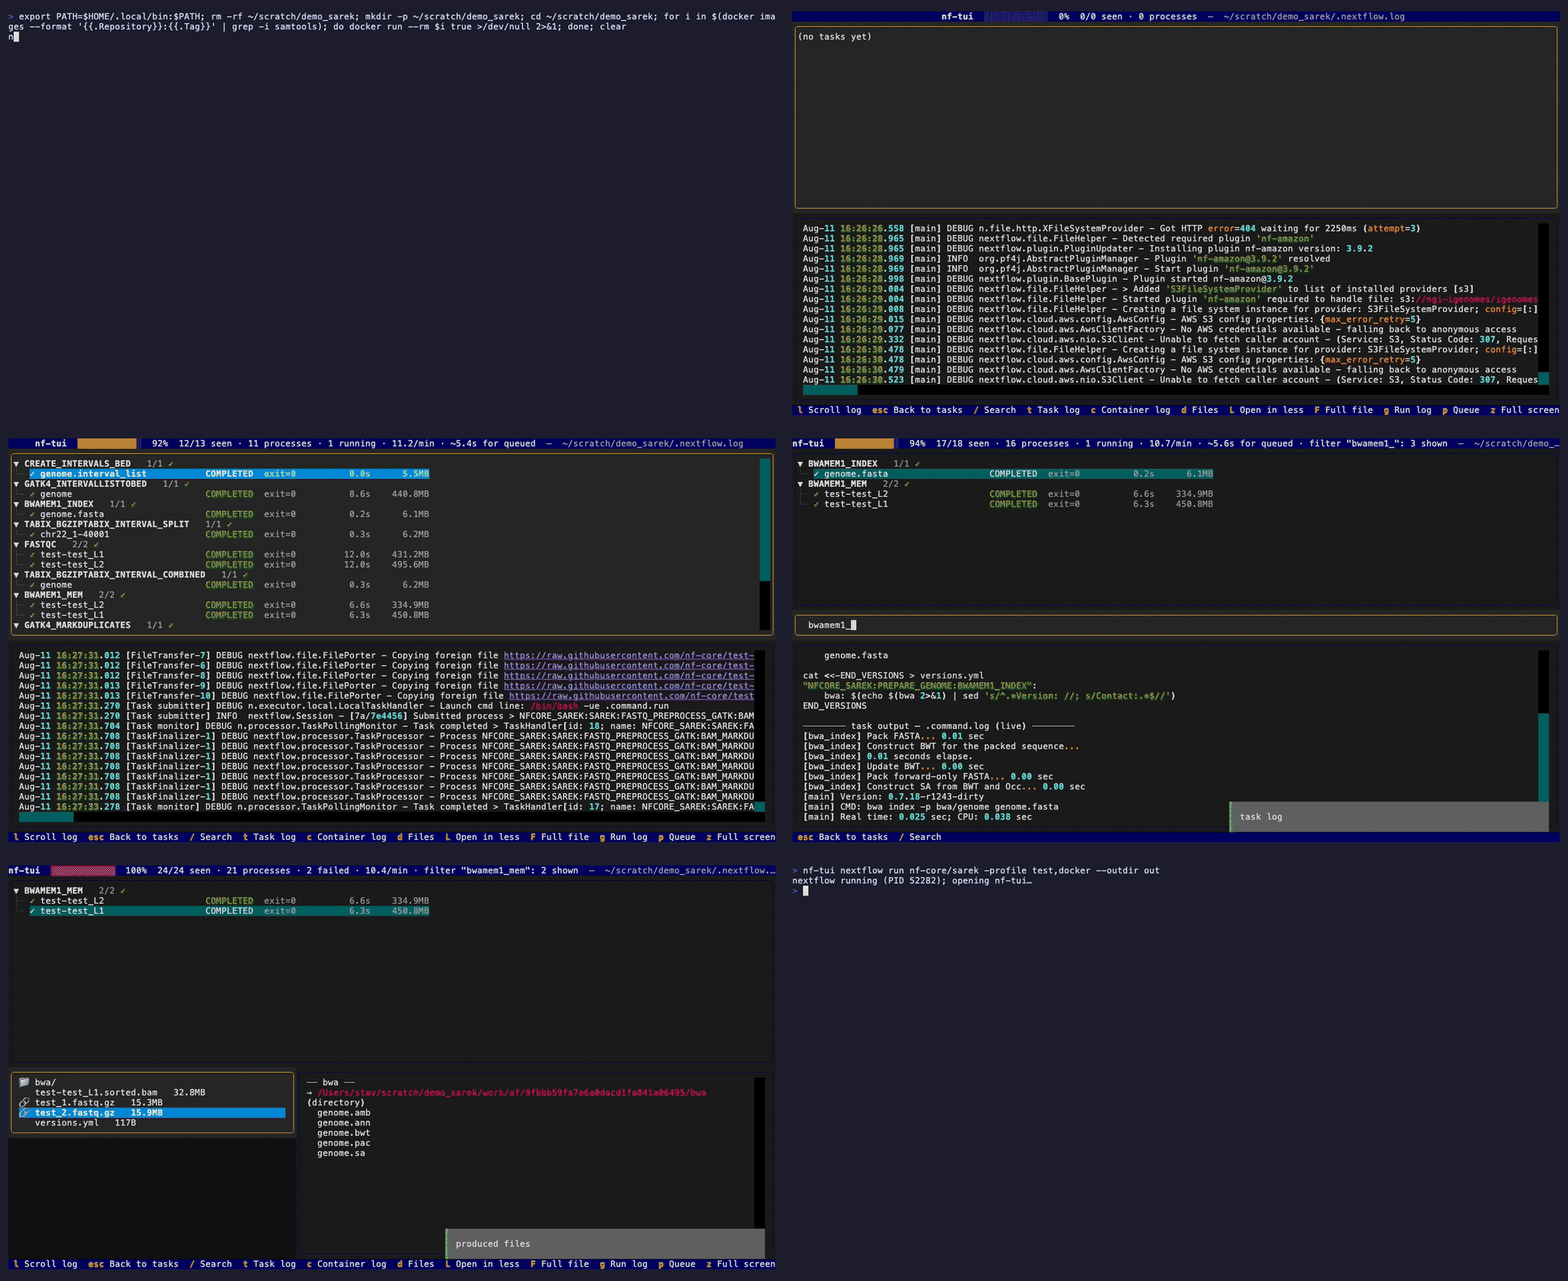
Use it either way
In your terminal, or in a browser tab. Same app, same code, same keys —
nf-tui-web serves the identical UI over a websocket. Both are local
processes reading local files; nothing is uploaded anywhere.
# no arguments: pick from the runs
# it finds here
nf-tui

# or open one directly
nf-tui /path/to/run

# prefix any nextflow command to
# launch it and watch it live
nf-tui nextflow run nf-core/sarek \
  -profile test,docker --outdir results
# or in a browser, on :8000
nf-tui-web /path/to/run

# same prefix, same flags,
# watched in the browser
nf-tui-web nextflow run nf-core/sarek \
  -profile test,docker --outdir results
Everything after the word nextflow is handed to Nextflow untouched,
including options that belong before run. nf-tui-web's own
options go before that word, so Nextflow's flags are never mistaken for
ours.
# on the login node, inside tmux
nf-tui-web /scratch/$USER/my-run \
  --host 127.0.0.1 --port 8000

# on your laptop
ssh -L 8000:localhost:8000 you@login-node
# then open http://localhost:8000
On a cluster this is the point of web mode: serve it on the login node,
forward the port, and get the whole UI in a browser on your laptop — no
X11, and nothing installed locally.
Use the same port at both ends. The page carries an absolute
websocket address built from --host/--port, so a
browser told ws://127.0.0.1:8000 looks for the tunnel entrance on
your machine at 8000. Map it elsewhere —
ssh -L 9000:localhost:8000 — and the page loads while the UI
never appears, with nothing on screen to say why.
What it does
no setup
Nothing to set up beforehand
You don’t have to decide to monitor a run before you start it. Point
nf-tui at any run directory — the one going right now, one a
colleague launched, one that failed in CI last week — and it reads
the log and work dirs Nextflow wrote anyway.
stays put
Nothing leaves your infrastructure
A local process reading local files. No run metadata, sample names or
paths go anywhere. Under GxP, PHI or IP constraints that removes a
review rather than starting one.
streams
A 10 GB output opens instantly
Every pane loads as you scroll — text, gzip, and BAM/CRAM decoded with
samtools from the task's own container, mounts and all.
-resume
Resumed runs aren't empty
A resumed run logs only Cached process lines and no task
handlers at all. Cached tasks are resolved against the work tree, so
their logs, outputs and metrics stay browsable.
any executor
Local, SLURM, k8s, AWS Batch
Grid executors label tasks differently — the scheduler's
jobId first, and started/exited after the
work dir — which is read properly, retries and all. Cloud work trees go
through your own aws / gcloud; no SDK is added.
which run?
Pick one, or watch it die
With no arguments it lists the runs it finds — state, age, task count,
percent done, failures — and marks the ones that stopped without
finishing as stalled. K stops a pipeline you launched
from nf-tui.
over ssh
Runs where the run is
Install it in your home directory on the login node. No daemon, no root,
no service. Or serve the same UI to a browser and forward the port.
The one screen
Task tree, the selected task's log, its output files with sizes as they're
written, the run log, and a squeue-style view of what's running
versus queued. The header carries live progress — counts, throughput and an
ETA for the queue — and every pane loads more as you scroll.
| Key | Find things |
|---|
e | next failure, and why it failed |
x | only the failures, then back again |
/ | filter the tree, or search the log |
n / N | next / previous match |
s | sort — slowest, then peak memory |
p | running vs queued, with elapsed times |
d | the task's output files, with sizes |
g | run log, at the tail |
| Key | Read it, or act on it |
|---|
t / c | task log / container log |
f | follow a live log as it's written |
L | open any of it in less |
F | pull in a bigger bite of a huge file |
z | full screen for one pane |
y / o | copy the work dir / open it |
K | stop the pipeline you launched |
tab / esc | next pane / back a level |
# the whole run, as data
nf-tui --json /path/to/run

# only what broke
nf-tui --json --failed /path/to/run

# with every task's .command.* logs
nf-tui --json --logs all /path/to/run

# one object per line while it runs
nf-tui --json --watch 5 /path/to/run
The same data the UI draws from, for a script or a CI job.
--logs chooses which tasks carry their .command.*
contents — failed by default, which is the debugging case and
the cheap one. --watch keeps emitting a line per interval while
the run is live, so you can pipe it somewhere.
For agents
nf-tui-mcp serves a run over MCP, so Claude or any MCP client can
ask what broke. One call returns every failed task with the reason — not just
the exit status.
# wire it up
claude mcp add nf-tui -- nf-tui-mcp

# tools it exposes
list_runs     get_run      get_failures
get_task      list_outputs read_output
tail_log      search_log
// get_failures, from a real run
"exit": "137",
"why": "error during connect: Get
  \"http://…/docker.sock/_ping\": EOF",
"cause": "…terminated with an
  error exit status (1)"
Nextflow's own Caused by: line reports the exit status. The reason
is what the command printed — here, the container runtime had died. An agent
reading only the exit status would have gone looking for a bug in the pipeline.
Install
# with uv — tracks main, so it picks up fixes
uv tool install git+https://github.com/stavgrossfeld/nf-tui

# or pip
pip install git+https://github.com/stavgrossfeld/nf-tui

# pin a release if you need a fixed version
uv tool install git+https://github.com/stavgrossfeld/nf-tui@v1.0.0
# what lands on your PATH
nf-tui       the terminal UI
nf-tui-web   the same, in a browser
nf-tui-mcp   the same, for agents
Python ≥ 3.10 is the only requirement. A container engine is needed for
viewing BAM/CRAM and nothing else.
What hasn't been tested
Parsing and container-command construction are pinned by tests built from
Nextflow's own output, and the Singularity path is executed against a shim
that behaves like the CLI. The SLURM path is now exercised the same way
— a pipeline run through Nextflow's own slurm executor against
stand-in sbatch/squeue binaries, which is what turned up
the grid-executor parsing bug. But that is a stand-in scheduler, not a real
slurmd, and nothing here has run against a real .sif or a
real AWS account — S3 is tested against MinIO with the real AWS CLI, which
speaks the same API but isn't AWS itself.
Reports from a real cluster are welcome.